

Introduction
Salesforce costs rarely spin out of control overnight. It usually starts with a simple assumption: we are buying a product. Licenses are calculated, an implementation is scoped, the business case is approved, and everyone expects the spend to stay within a predictable range.
In practice, Salesforce functions as the central system supporting customer and revenue operations. As more teams use Salesforce, integrations grow, and business needs shift, the effort required to keep the platform stable also increases.
It is this effort that ultimately shapes long-term cost.
A few structural choices shape how costs change. How clearly ownership is defined, how much complexity has accumulated over the years, how many systems interact with Salesforce, how strict your governance processes are, and whether the team is set up to work proactively or reactively. These factors create dramatically different Total Cost of Ownership (TCO) profiles even among organizations with similar license footprints.
A TCO view helps you step back from license fees and ask better questions:
1. What are the hidden cost layers behind our licenses?
2. Which activities consistently consume the most effort, and why?
3. Are we relying on a support model that fits the way our environment actually operates?
4. How much of our current spend goes into rework, technical debt, and recurring issues?
5. What strategic work is not happening because teams are busy just keeping the system running?
Instead of treating TCO as a finance exercise, we treat it as a practical lens on how your Salesforce environment truly operates and evolves.
Why Traditional Salesforce Budgeting Fails
Most Salesforce budgets start with a simple calculation: number of users × license price. For example, 100 Sales Cloud Enterprise users at $175 per user per month equals $210,000 a year.
In a typical scenario, you need an implementation partner to configure the platform. Your ERP needs to integrate with Salesforce, requiring development work plus annual licensing for the integration platform. Data migration from your legacy CRM adds another substantial expense.
Once the system goes live, you would need someone to manage it. A Salesforce administrator requires salary, benefits, and overhead. Users need training for initial onboarding plus ongoing enablement. Soon users want enhancements - sales wants custom forecasting, service needs intelligent routing.
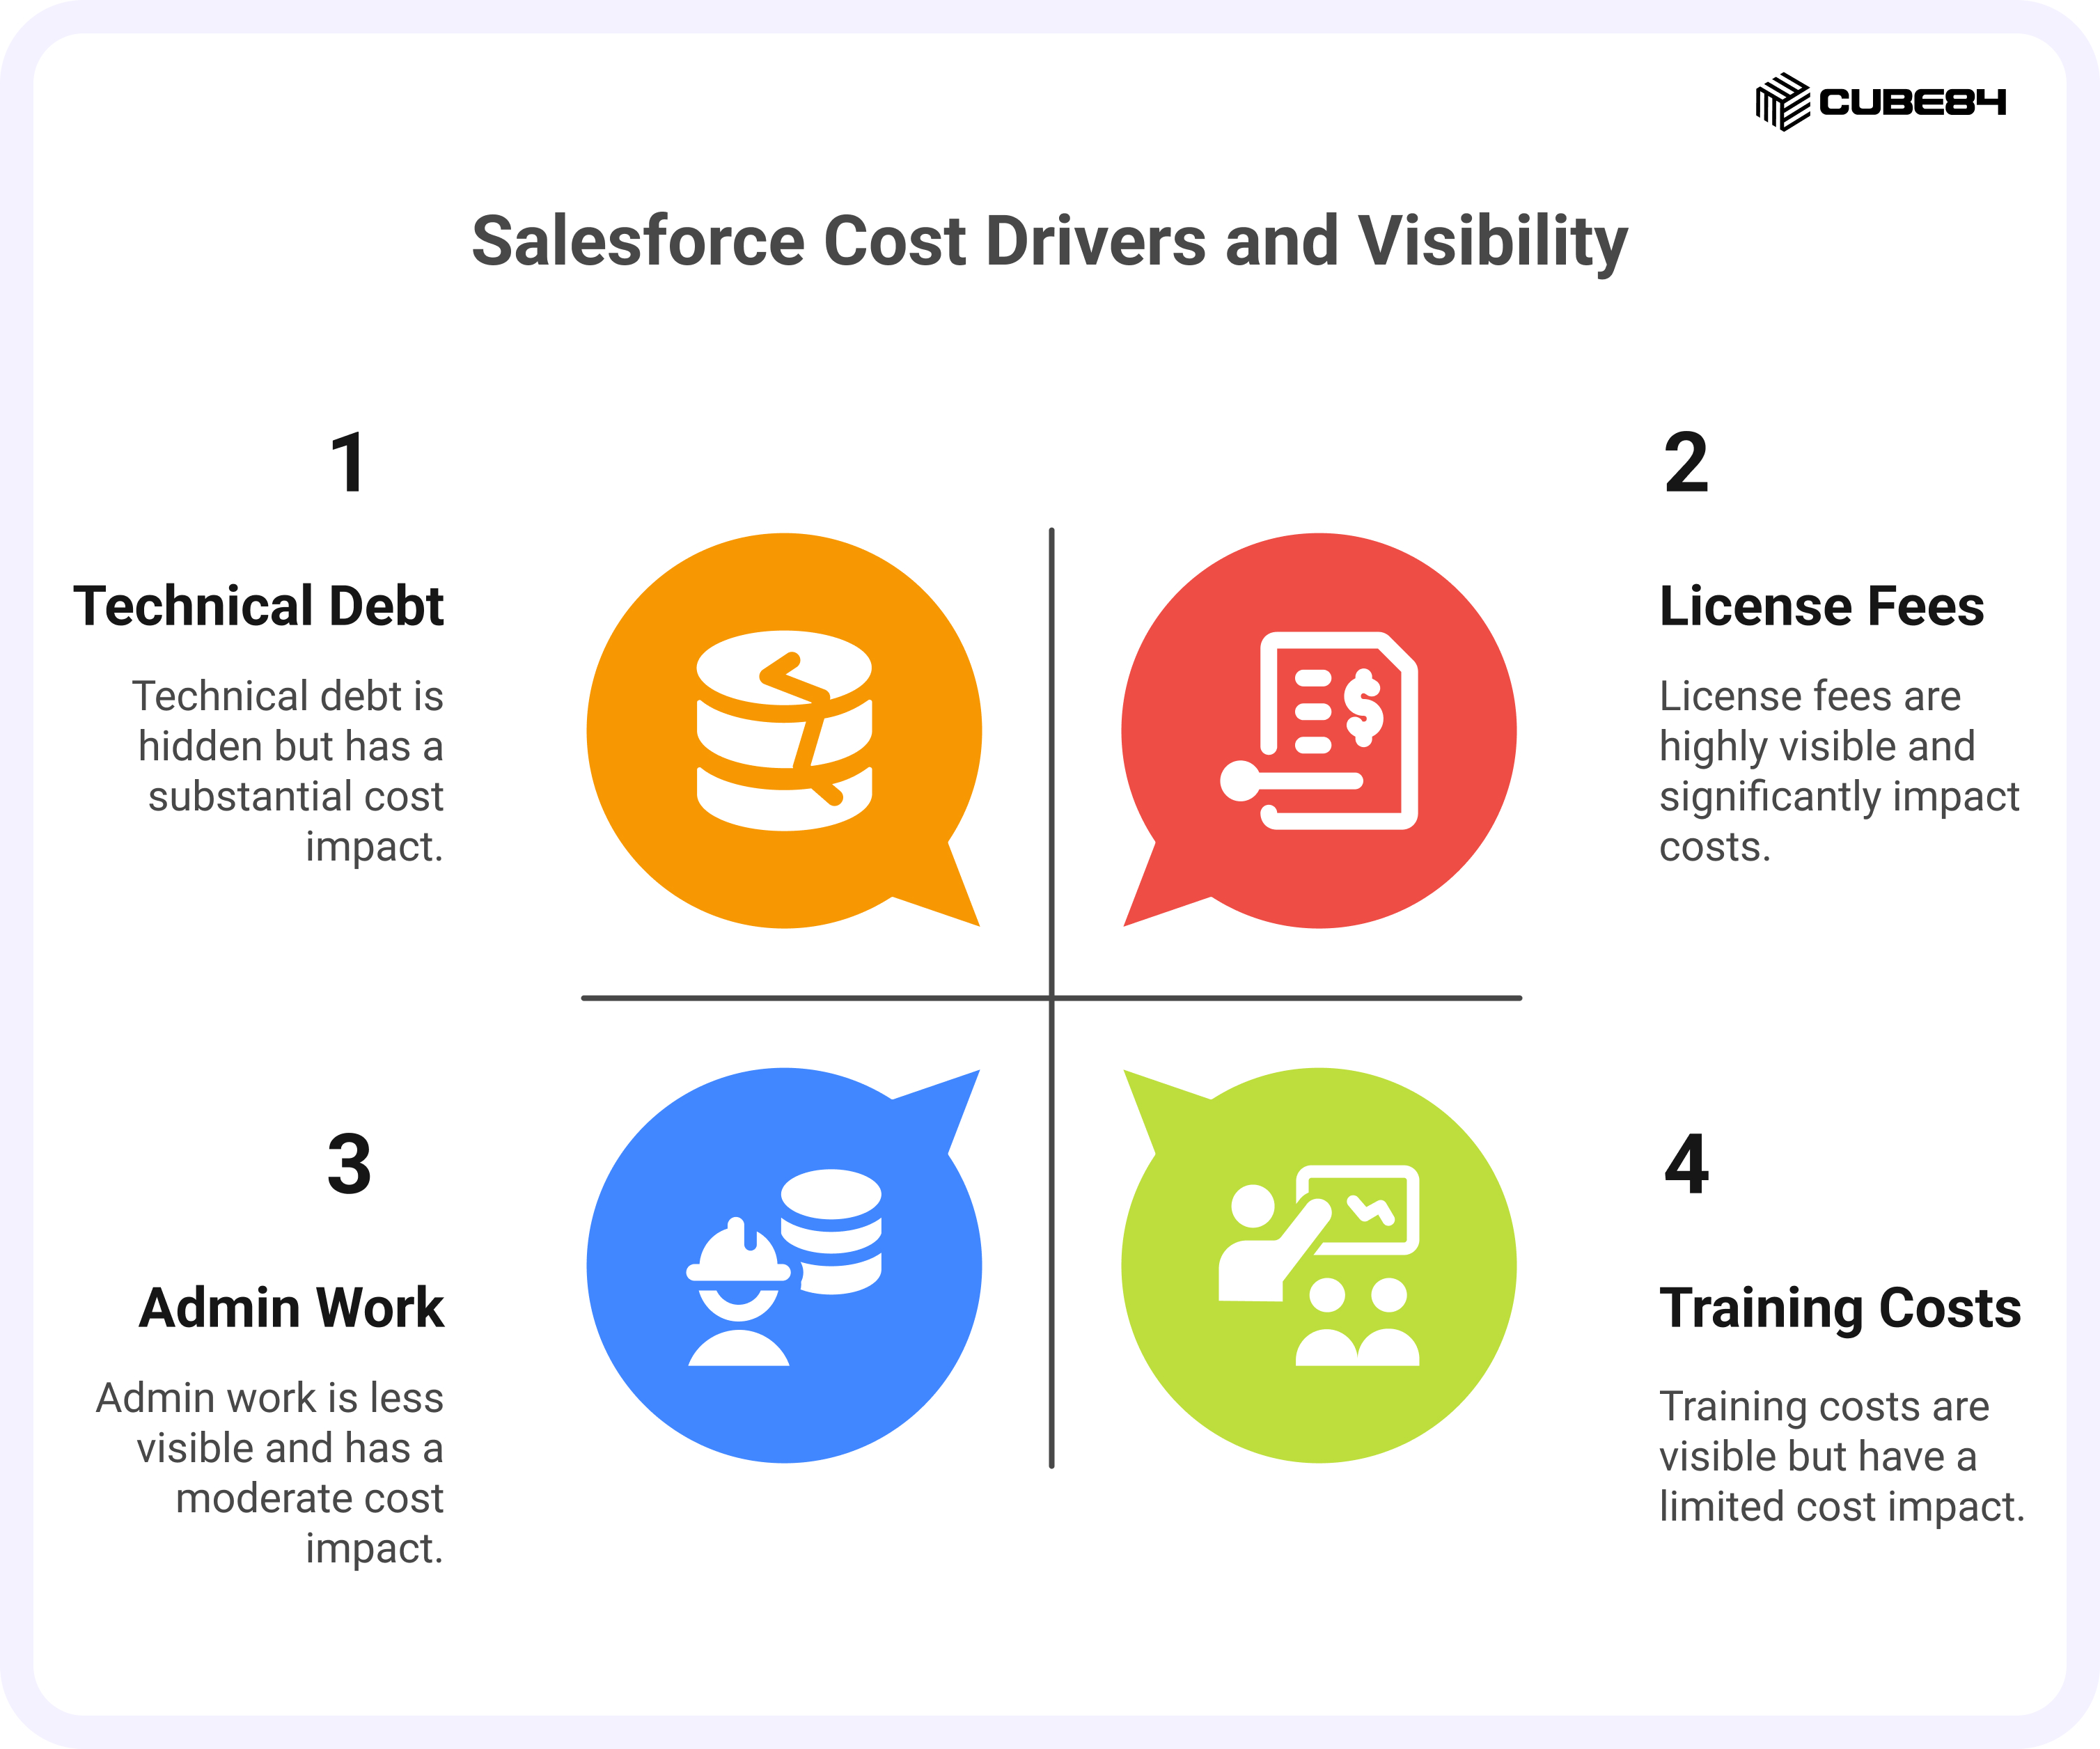
In eighteen or twenty-four months costs have risen substantially, and it surprises leaders! The escalation isn’t caused by unexpected license increases or runaway consulting hours. It’s caused by the gap between how organizations think Salesforce works and how it actually operates in practice.
Every new workflow, every process change, every integrated system, every data-quality issue, every release cycle, and every enhancement request adds incremental effort. Over time, that effort compounds. The platform becomes more deeply embedded in daily operations, which increases the amount of work needed to keep it stable and aligned with the business.
This happens across thousands of organizations, and it is because Salesforce is treated like a one-time project when it actually behaves like an ongoing operational system. Budgeted as CapEx, it functions as OpEx.
Why Salesforce Costs More Than the License Price
License fees are the part of the iceberg you can see. The true weight of Salesforce ownership sits below the surface in the ongoing work needed to keep the platform reliable and scalable.
Common operational cost drivers include:
1. Implementation and customization work
2. Continuous development and support
3. Training and change management
4. Data quality and governance
5. Integration and infrastructure maintenance
6. Downtime, rework, and other opportunity costs
7. Accumulating technical debt
Weak or inconsistent governance practices
Some cost drivers do not appear on any invoice but still influence your total investment. Salesforce data shows how operational effort becomes a hidden cost. Service reps spend only 46% of their time directly helping customers, while the rest is consumed by admin work, navigating systems, and workaround steps. Across large teams, that time loss compounds into significant recurring effort and ultimately becomes part of long-term TCO.
This is where Total Cost of Ownership (TCO) becomes essential. It captures every dollar spent on Salesforce, directly or indirectly, across all departments and cost categories. It includes obvious expenses like licenses and consultants, but also hidden costs like administrator salaries, integration platform fees, training investments, and productivity losses from poor data quality or system downtime.
Understanding TCO supports more informed decisions about your Salesforce investment. Should you build custom functionality or buy an AppExchange solution? Should you staff an internal admin team or engage a managed service provider? Is your current spending reasonable or does it signal inefficiency?
Who This Guide Is For & What It Covers?
This guide is for financial decision makers and leaders, operations leaders, and Salesforce program owners who want a clear, data-driven view of their Salesforce spending.
What You'll Learn:
1. What Salesforce Total Cost of Ownership (TCO) includes across your environment
2. How to identify every direct and indirect cost category driving your CRM expenses
3. A step-by-step framework to build your own TCO model and benchmark it against industry standards
4. How to use CUBE84’s Managed Services Cost Calculator to project your annual and per-user costs
What Shapes Salesforce Cost Inside Your Organization
A clear view of Salesforce TCO begins with understanding the environment in which the system operates. Long-term cost is shaped by the choices an organization makes about how Salesforce is staffed, structured, connected, and governed.
The areas below help explain why overall effort grows and why cost patterns vary across organizations.
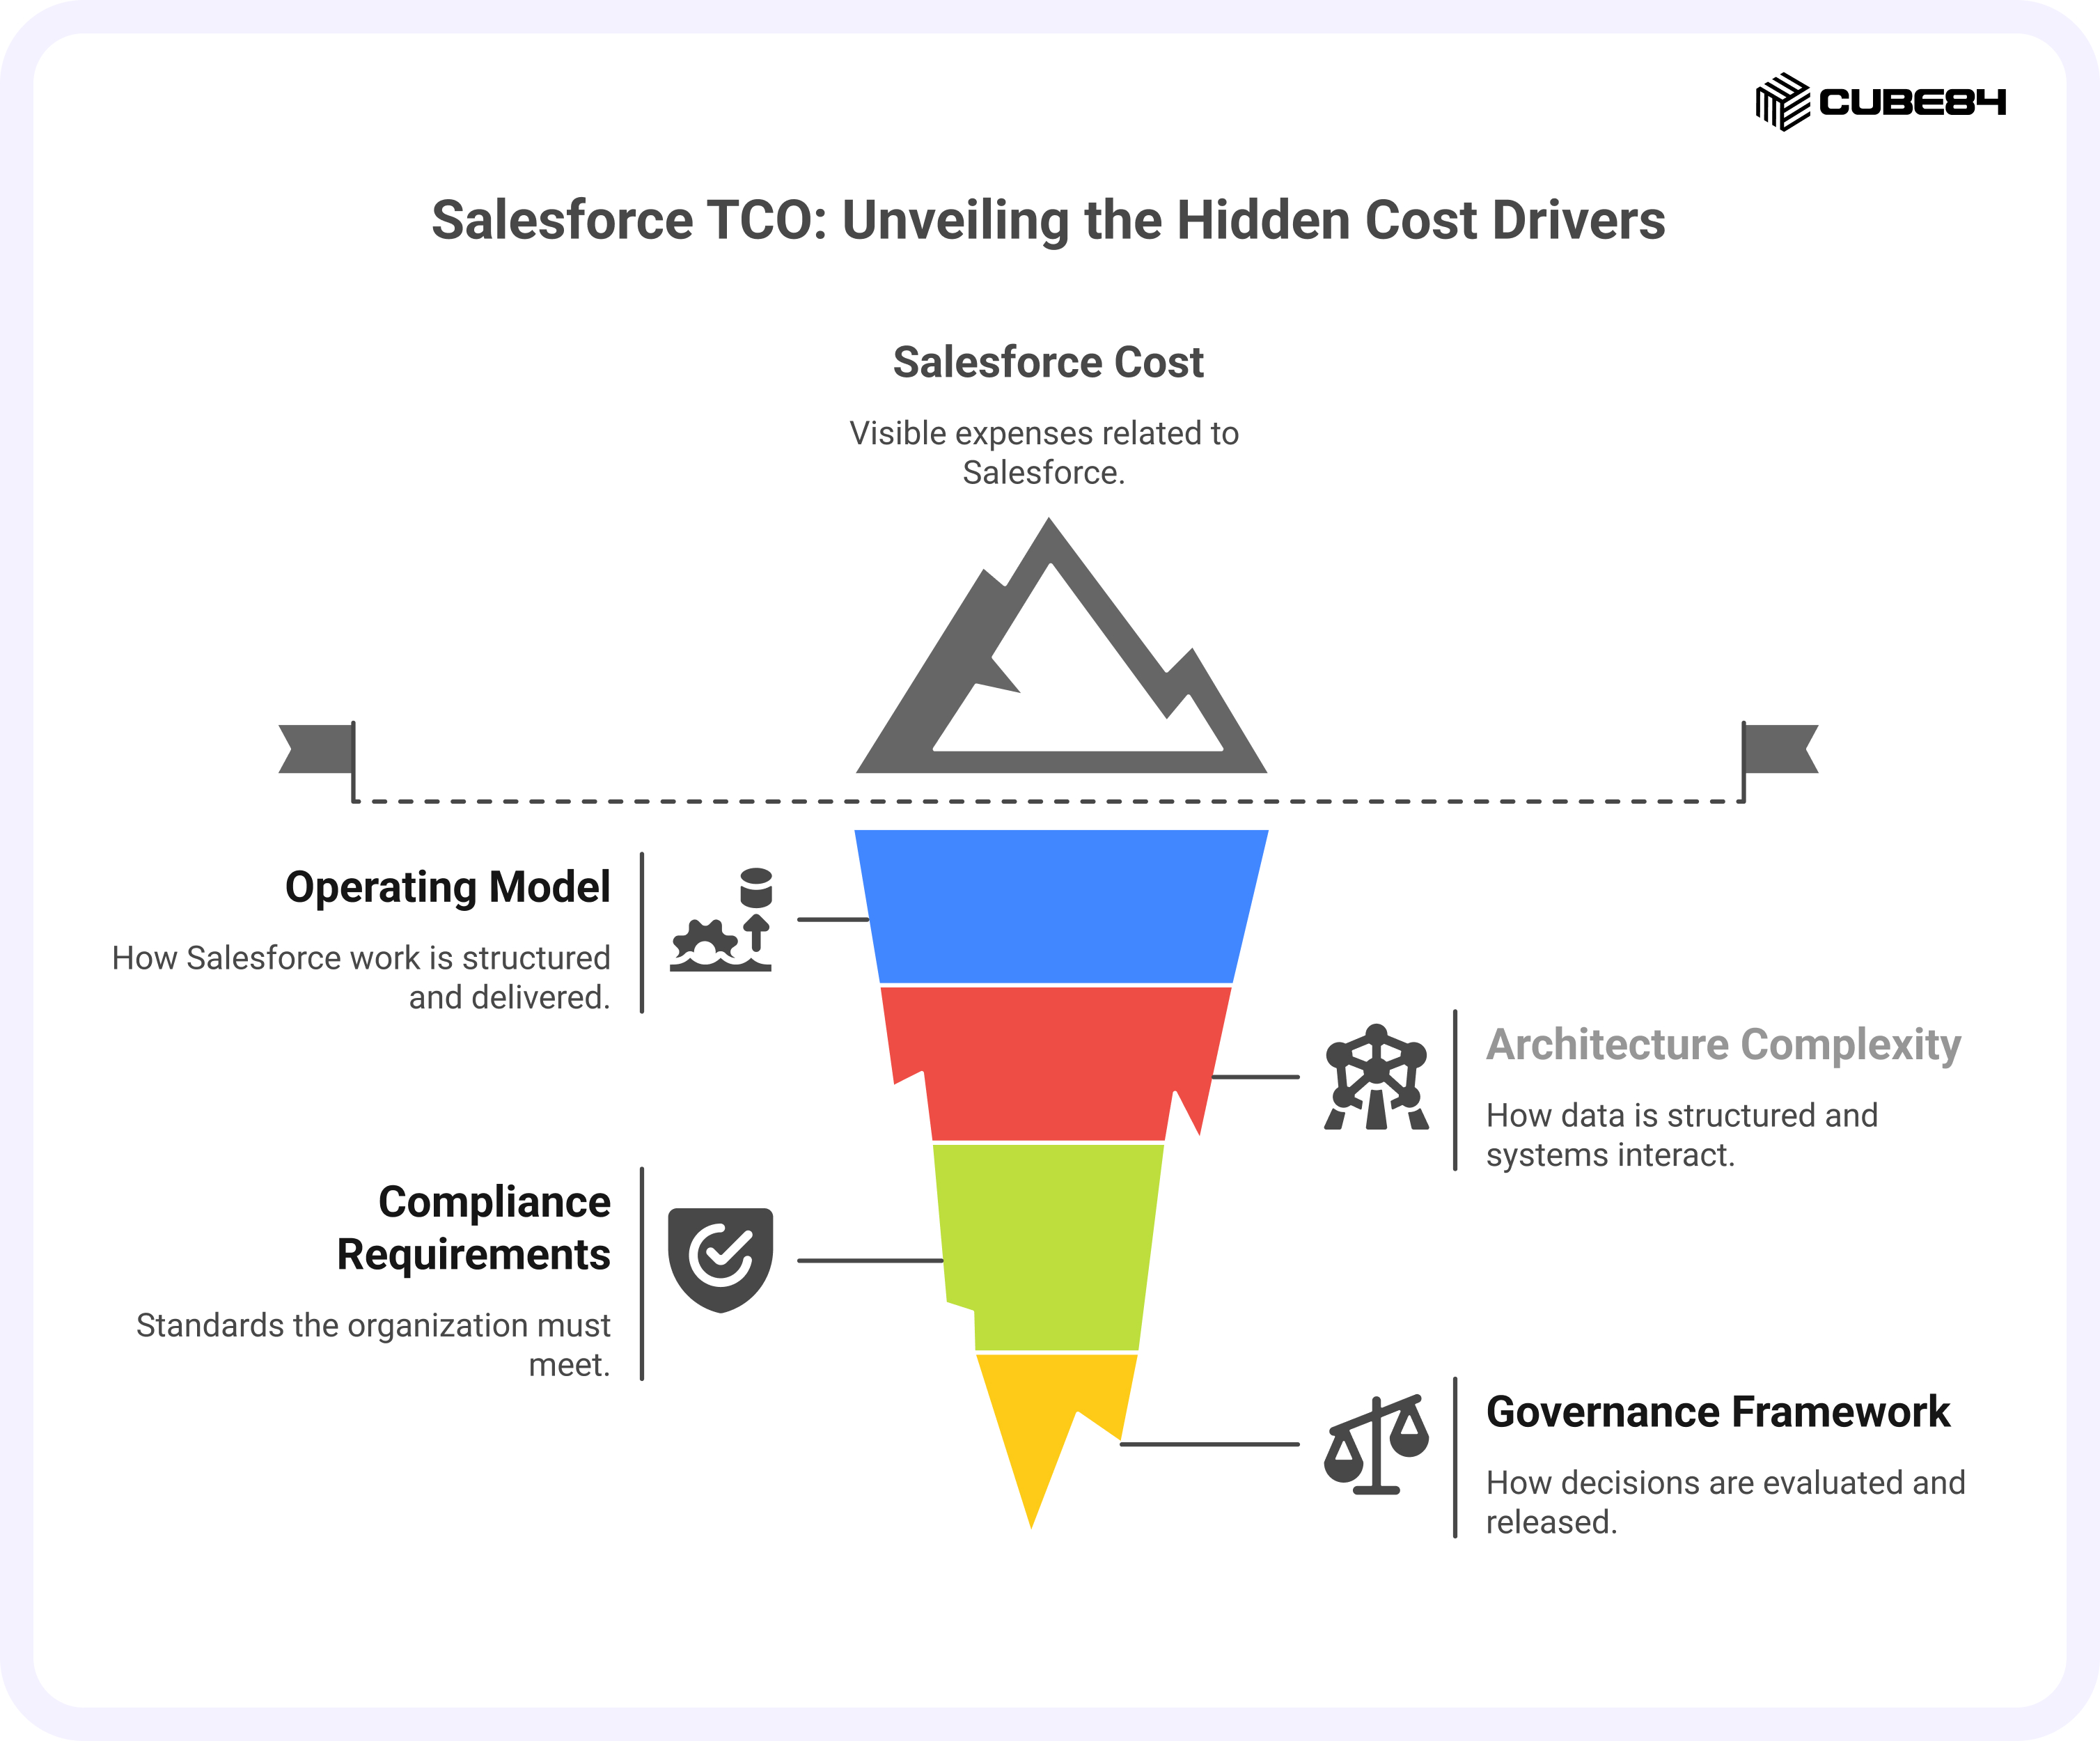
Operating Model: How Salesforce Work Is Structured and Delivered
The operating model defines who manages Salesforce and how work flows through the system.
Organizations use a mix of internal staff, contractors, managed services, or hybrid models. Each choice influences responsiveness, quality, and recurring cost.
The operating model also determines how well the environment is monitored and maintained. Common activities include release testing, admin tasks, user support, integration oversight, and ongoing development. Workload grows as more teams adopt Salesforce.
Integration upkeep inside the operating model
Different types of integrations add different levels of recurring effort:
1. Salesforce APIs create one-time build cost but require monitoring and updates as systems evolve.
2. Out-of-the-box connectors such as DocuSign or QuickBooks introduce subscription and configuration maintenance.
3. Middleware such as Mulesoft, Jitterbit, Skyvia, Dell Boomi, or Zapier requires ongoing review of jobs, error handling, and version updates.
The more systems Salesforce connects to, the more coordination, testing, and troubleshooting the operating model must support.
A practical guideline is that roughly every fifty Salesforce users require one full-time administrator to keep daily operations running smoothly. Smaller teams may combine responsibilities across roles, while larger environments often need specialized skills to maintain stability. When a capable internal team or experienced partner is in place, monitoring improves and the instance stays healthier over time.
CUBE84 insight: Rising Salesforce cost is often linked to unclear ownership rather than technical limitations. A stable operating model provides predictability before any cost optimization begins.
External Architecture and Configuration Complexity: How the Org Has Evolved
Architecture defines how data is structured and how systems interact with Salesforce. Configuration represents the objects, fields, automations, code, and UI elements added over time. Together, these create the foundation that all enhancements, releases, and integrations depend on.
When the architecture is clear and the configuration is streamlined, routine work moves quickly. Enhancements require fewer checks, and release testing is manageable. As complexity grows, even small changes require more review and coordination. This increases effort even when the change itself is small.
Over time, older decisions accumulate. Layers of automation, unused objects, redundant fields, and outdated custom code begin to slow down day-to-day work. This is often when administrators and developers notice that simple updates take longer and require more careful testing.
CUBE84 insight: Most long-term cost does not come from major features. It comes from older design choices that were never revisited as the business evolved.
Compliance: The Standards the Organization Must Meet
Compliance requirements influence how Salesforce changes are reviewed, tested, documented, and approved. These controls come from internal security teams, auditors, regulators, or legal departments.
Common compliance activities include:
1. Structured testing and validation
2. Documenting changes for audit review
3. Security assessments and access checks
4. Data retention and logging requirements
5. Privacy and consent management
Some organizations need light documentation. Others must follow detailed validation cycles. Both approaches serve a clear purpose based on industry, data sensitivity, and risk exposure.
CUBE84 insight: In compliance-focused environments, review steps add significant effort. This is a major contributor to long-term TCO.
Governance: How Decisions Are Evaluated and Released
Governance defines the structure that guides intake, prioritization, design decisions, impact assessment, and release management. It ensures the right work moves forward at the right time.
A strong governance framework includes clear steps:
1. Intake of new requests
2. Impact analysis by technical or business leads
3. Review by a product owner or steering group
4. Prioritised release cycles
5. Documented ownership for features and processes
Without this structure, teams introduce quick fixes that bypass review, which leads to inconsistent builds and growing technical debt. Over time, this increases effort across release testing, troubleshooting, and enhancement cycles. Strong governance reduces friction and stabilizes cost. Weak governance increases effort in almost every TCO category.
CUBE84 insight: Many cost issues stem from unclear intake and prioritization. When work moves through a consistent structure, both stability and cost improve.
With the environment defined, the next step is to review the major cost categories that contribute to Salesforce TCO and understand how each one shapes long-term effort.
The Core Categories of Salesforce TCO
Salesforce TCO covers the full scope of work, tools, and resources involved in running the platform each year. It includes eight major cost categories:
1. Direct Salesforce costs
2. Implementation and development costs
3. Personnel costs
4. Training and adoption
5. Maintenance and operations
6. Integration and infrastructure
7. Data management
8. Opportunity costs and risks
These categories form the complete view of what it takes to keep Salesforce stable, effective, and aligned with business needs. The tables below outline each category, what it includes, and why it matters.
Direct Salesforce Costs
Subcategory | What It Includes | Why It Matters |
Licenses and Subscriptions | • User licenses for each cloud | Forms the recurring base of Salesforce spend. |
AppExchange and Third-Party Apps | • Productivity apps used for documents, signatures or quoting | Adds important capability and creates additional recurring commitments. |
Data and Storage | • Additional data storage for records | Grows as teams expand usage and store more data. |
Support Contracts | • Salesforce Premier Success packages | Ensures timely support and system stability. |
Implementation and Development Costs
Subcategory | What It Includes | Why It Matters |
Initial Implementation | • Requirements and discovery workshops | Sets the foundation for long-term stability and maintainability. |
Ongoing Development | • Building new features requested by teams | Keeps Salesforce aligned with changing business requirements. |
Consultation and Strategy | • Business analysis for new needs | Helps maintain consistency and avoid work that causes future rework. |
Personnel Costs
Subcategory | What It Includes | Why It Matters |
Internal Staff | Salesforce administrators | Core staffing required for day-to-day support and long-term growth. |
Contract and Augmented Staff | • Contractors hired for specific skills | Provides flexibility but often at a higher hourly cost. |
Managed Services Providers | • Monthly support retainers | Outsources support and helps manage workload fluctuations. |
Transition and Ramp-Up Work | • Onboarding new team members | Creates temporary slowdowns and affects continuity. |
Training and Adoption
Subcategory | What It Includes | Why It Matters |
Formal Training | • Courses for admins and developers | Builds skills needed to maintain and use Salesforce effectively. |
Internal Training and Enablement | • Creating internal training content | Improves adoption and reduces avoidable support tickets. |
Change Management | • Communication planning for updates | Helps users adjust to new workflows and avoid confusion. |
Lost Productivity | • Time users spend learning new features | Creates indirect cost whenever changes are introduced. |
Maintenance and Operations
Subcategory | What It Includes | Why It Matters |
Formal Training | • Courses for admins and developers | Builds skills needed to maintain and use Salesforce effectively. |
Internal Training and Enablement | • Creating internal training content | Improves adoption and reduces avoidable support tickets. |
Change Management | • Communication planning for updates | Helps users adjust to new workflows and avoid confusion. |
Lost Productivity | • Time users spend learning new features | Creates indirect cost whenever changes are introduced. |
Maintenance and Operations
Subcategory | What It Includes | Why It Matters |
Release Management | • Testing the three major Salesforce releases each year | Keeps the environment stable through platform updates. |
System Administration | • Creating, modifying, and removing users | Covers essential daily operations and keeps Salesforce aligned with business changes. |
Technical Maintenance | • Reviewing and improving older code | Prevents issues from building up and protects system health. |
Support and Helpdesk | • Handling user support tickets | Provides continuous support for internal teams. According to the Salesforce State of Service report, 64% of service leaders expect service volumes to rise over the next 18 months, signaling growing workloads across administration, troubleshooting, and release management. |
Integration and Infrastructure
Subcategory | What It Includes | Why It Matters |
Integration Platform Costs | • Middleware subscriptions | Supports data movement between Salesforce and other systems. |
Integration Development and Maintenance | • Building new integrations | Required as connected systems change or expand. |
Related Infrastructure | • Database licenses for connected systems | Supports the larger technology environment Salesforce interacts with. |
Data Management
Subcategory | What It Includes | Why It Matters |
Data Quality Tools and Processes | • Deduplication tools | Ensures accuracy and improves decision-making across teams. |
Governance and Compliance | • Privacy and consent tools | Helps maintain compliance and protects sensitive data. |
Data Migration and Cleanup | • Cleanup of older records | Keeps data usable, organized, and easier to maintain. |
Opportunity Costs and Risks
Subcategory | What It Includes | Why It Matters |
Technical Debt | • Fixing older configurations | Adds recurring effort and slows down future changes. |
Process Inefficiencies | • Low user adoption | Reduces the value Salesforce is able to deliver. |
Risk and Redundancy | • High dependence on a single admin | Creates operational and security vulnerabilities. |
Resource Diversion | • Time spent on maintenance instead of strategic projects | Slows progress on long-term business goals. |
Together, these categories outline everything that contributes to Salesforce effort and cost. This foundation makes it easier to create a TCO model that is practical and repeatable.
How to Build a Practical Salesforce TCO Model
A reliable TCO model comes from understanding the work that keeps Salesforce running. This section walks through the steps that help you build a clear, evidence-based view of your actual investment. The goal is not to achieve perfect accuracy on day one, but to create a model that is structured, repeatable, and trusted.
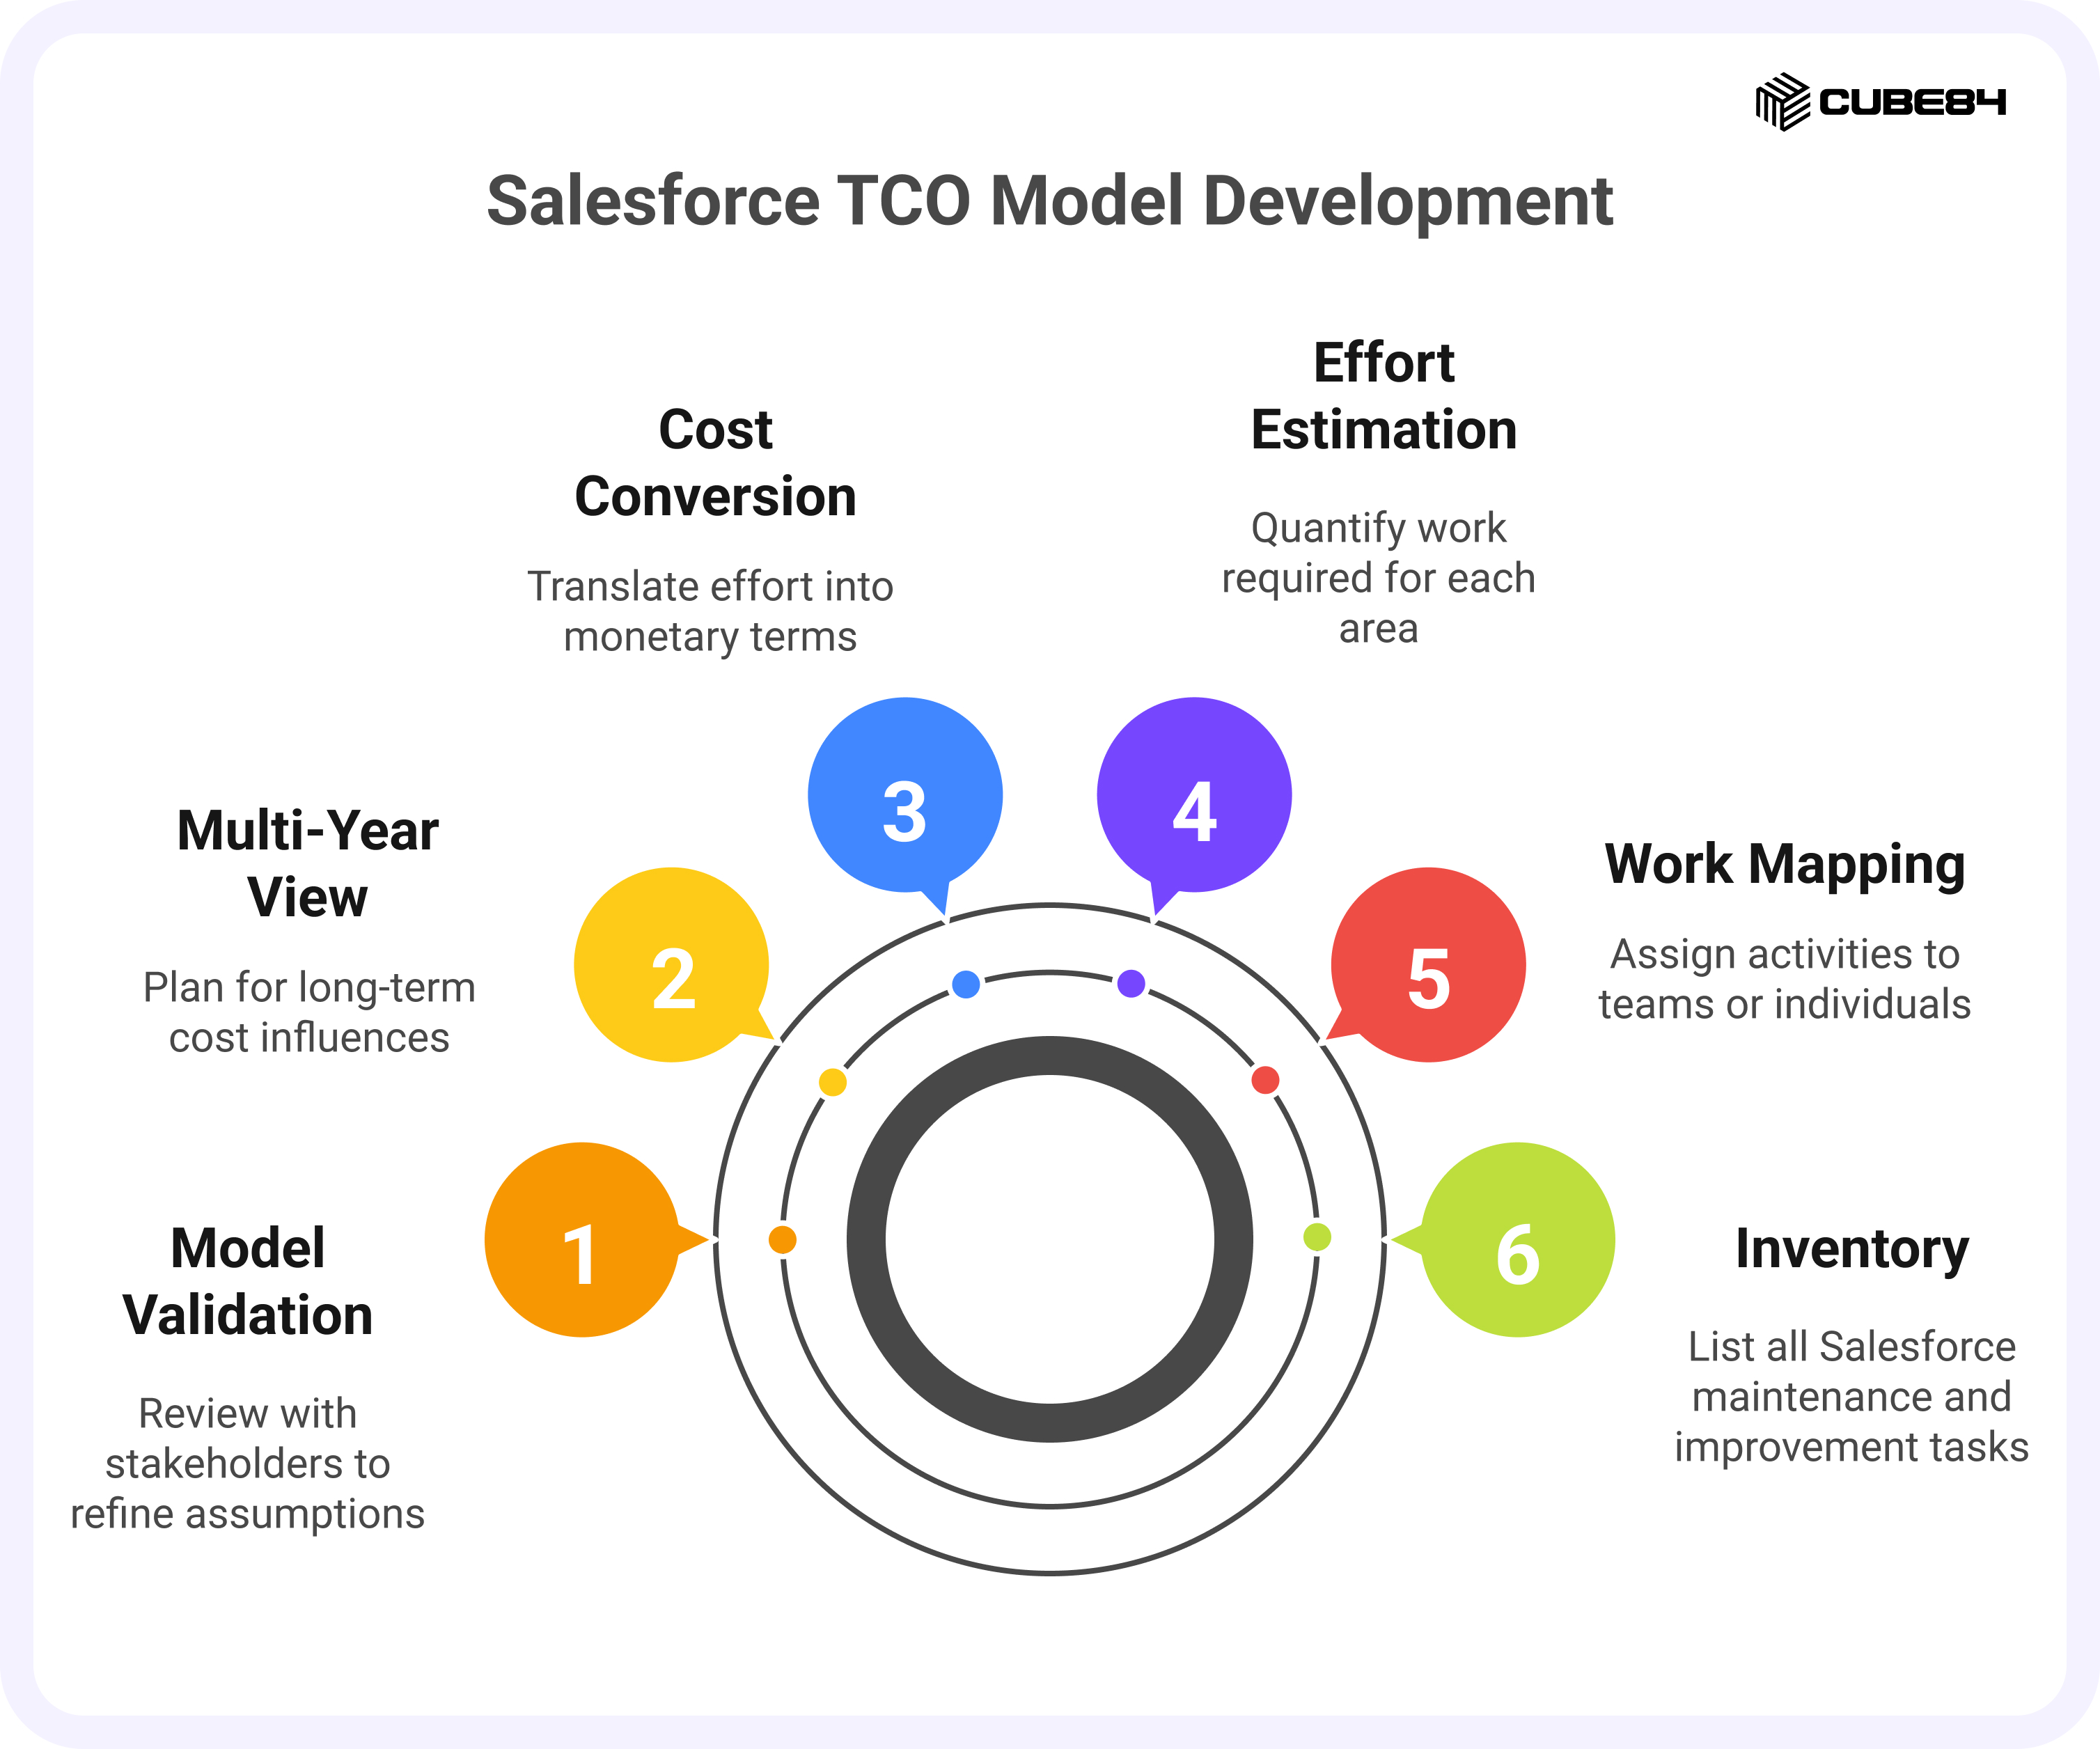
1. Start With a Clear Inventory of Your Salesforce Work
Begin with a simple, factual list of the activities involved in maintaining and improving Salesforce. Use the eight TCO categories so nothing is overlooked.
What to capture
• Daily, weekly, monthly, and quarterly tasks
• Enhancements already requested by users
• Work currently in progress
• Tools and platforms connected to Salesforce
• Informal or undocumented work handled by individuals
• Activities that do not have a clear owner
A complete inventory gives your model a strong foundation and prevents gaps later.
2. Map Work to Your Operating Model
Salesforce cost depends on who does the work and how responsibilities are distributed. Once you list the work, map each activity to the teams or individuals handling it today.
What to document
• Work handled by internal staff
• Work covered by partners, consultants or freelancers
• Activities included in a managed services agreement
• Dependencies on IT, data, or security teams
• Work that is currently unassigned
This helps you understand which parts of your cost structure are fixed, flexible, or unmanaged.
3. Estimate the Effort Required for Each Area
Use effort estimates to anchor your cost model. Use available data wherever you can.
Where to look
• Support tickets and helpdesk logs
• Enhancement backlogs and change requests
• Integration incident logs
• Previous release testing cycles
• User onboarding and training patterns
• Periodic data cleanup work
• Notes from earlier audits or architecture reviews
An effort-based view shows how work is distributed and where demand tends to increase.
4. Convert Effort Into Cost
Once effort is estimated, convert it into cost using a consistent method.
This table outlines how each type of resource should be calculated.
Cost Conversion Table
Resource Type | How to Calculate Cost | What to Include | Notes |
Internal teams | Fully loaded hourly cost × hours allocated | • Percentage of time spent on Salesforce • Leadership or oversight time | Reflects the ongoing operational load across roles. |
Contractors and augmented staff | Hourly or daily rate × actual or averaged hours | • Project-based work • Short-term or specialized assignments | Useful when skills are needed only for specific periods. |
Managed services | Monthly retainer + any additional work | • Scope included in retainer • Out-of-scope project work • On-demand support | Provides predictable coverage for core activities. |
Other cost considerations | Add to total based on effort impact | • Hiring and ramp-up time • Knowledge transfer during turnover | Helps capture transition-related costs often overlooked. |
Build a Multi-Year View
A TCO model becomes more accurate when viewed across several years instead of a single budget cycle. This helps you plan for growth, upcoming projects, and recurring patterns that influence long-term cost.
Multi-Year Planning Table
What to Plan For | Why It Matters |
Growth in users or teams | Signals increased workload, support needs, and potential license changes. |
New integrations | Adds ongoing maintenance and testing effort once the integration is live. |
Governance changes | Shifts how work is reviewed, approved, and tested, which affects effort distribution. |
Future phases or planned projects | Introduces predictable development and release cycles over the next few years. |
Technical debt remediation | Reduces rising effort caused by outdated or inefficient builds. |
Recurring effort patterns | Helps stabilize budgets by identifying areas that repeat year after year. |
A multi-year outlook provides smoother planning and gives leaders a clearer sense of how Salesforce effort and cost will evolve over time. Multi-year planning should also take into account Salesforce’s periodic price adjustments and licensing updates.
A Note on AI Add-On Contracts
Some Salesforce products stay stable over time and work well with multi-year agreements. AI add-ons change more quickly in both pricing and usage patterns, so shorter contract terms can offer more flexibility as the product improves. This helps keep long-term cost planning more accurate.
Validate the Model With Key Stakeholders
Once the model is drafted, review it with the teams involved in Salesforce. Their input helps refine assumptions and correct gaps.
Stakeholder Validation Table
What to Confirm | Who to Involve |
Effort estimates | • Salesforce administrators • Technical teams |
Ownership of activities | • Integration leads • Data platform owners |
Cost inputs | • Finance teams • FP&A partners |
Expected changes in the coming year | • Operations leaders • Business system owners |
CUBE84 Insight: Validation works best when each team confirms the effort they own and the effort they influence. This creates a model that reflects how your organization actually operates.
Use the Model to Identify Improvement Opportunities
A TCO model highlights patterns across your environment. These patterns show where effort is higher than it should be or where work is slowed down.
Where to look
• Rework caused by technical debt
• Manual tasks that can be automated
• Integrations that generate recurring issues
• Repeated requests tied to the same process
• Work that moves between teams without clear ownership
• Areas where cost grows faster than usage
These findings help you improve system quality and reduce friction for teams.
Prepare the Model for Scenario Comparison
After you have a complete view of your current TCO, prepare it for scenario planning. This helps leaders compare different operating approaches.
Scenarios to evaluate
• Internal team versus contractor versus managed services
• Lighter governance versus structured governance
• Complex architecture versus simplified architecture
• Heavy integration use versus minimal integration
A scenario-ready model helps you evaluate different ways to manage Salesforce in the future.
How TCO Changes Across Different Salesforce Environments
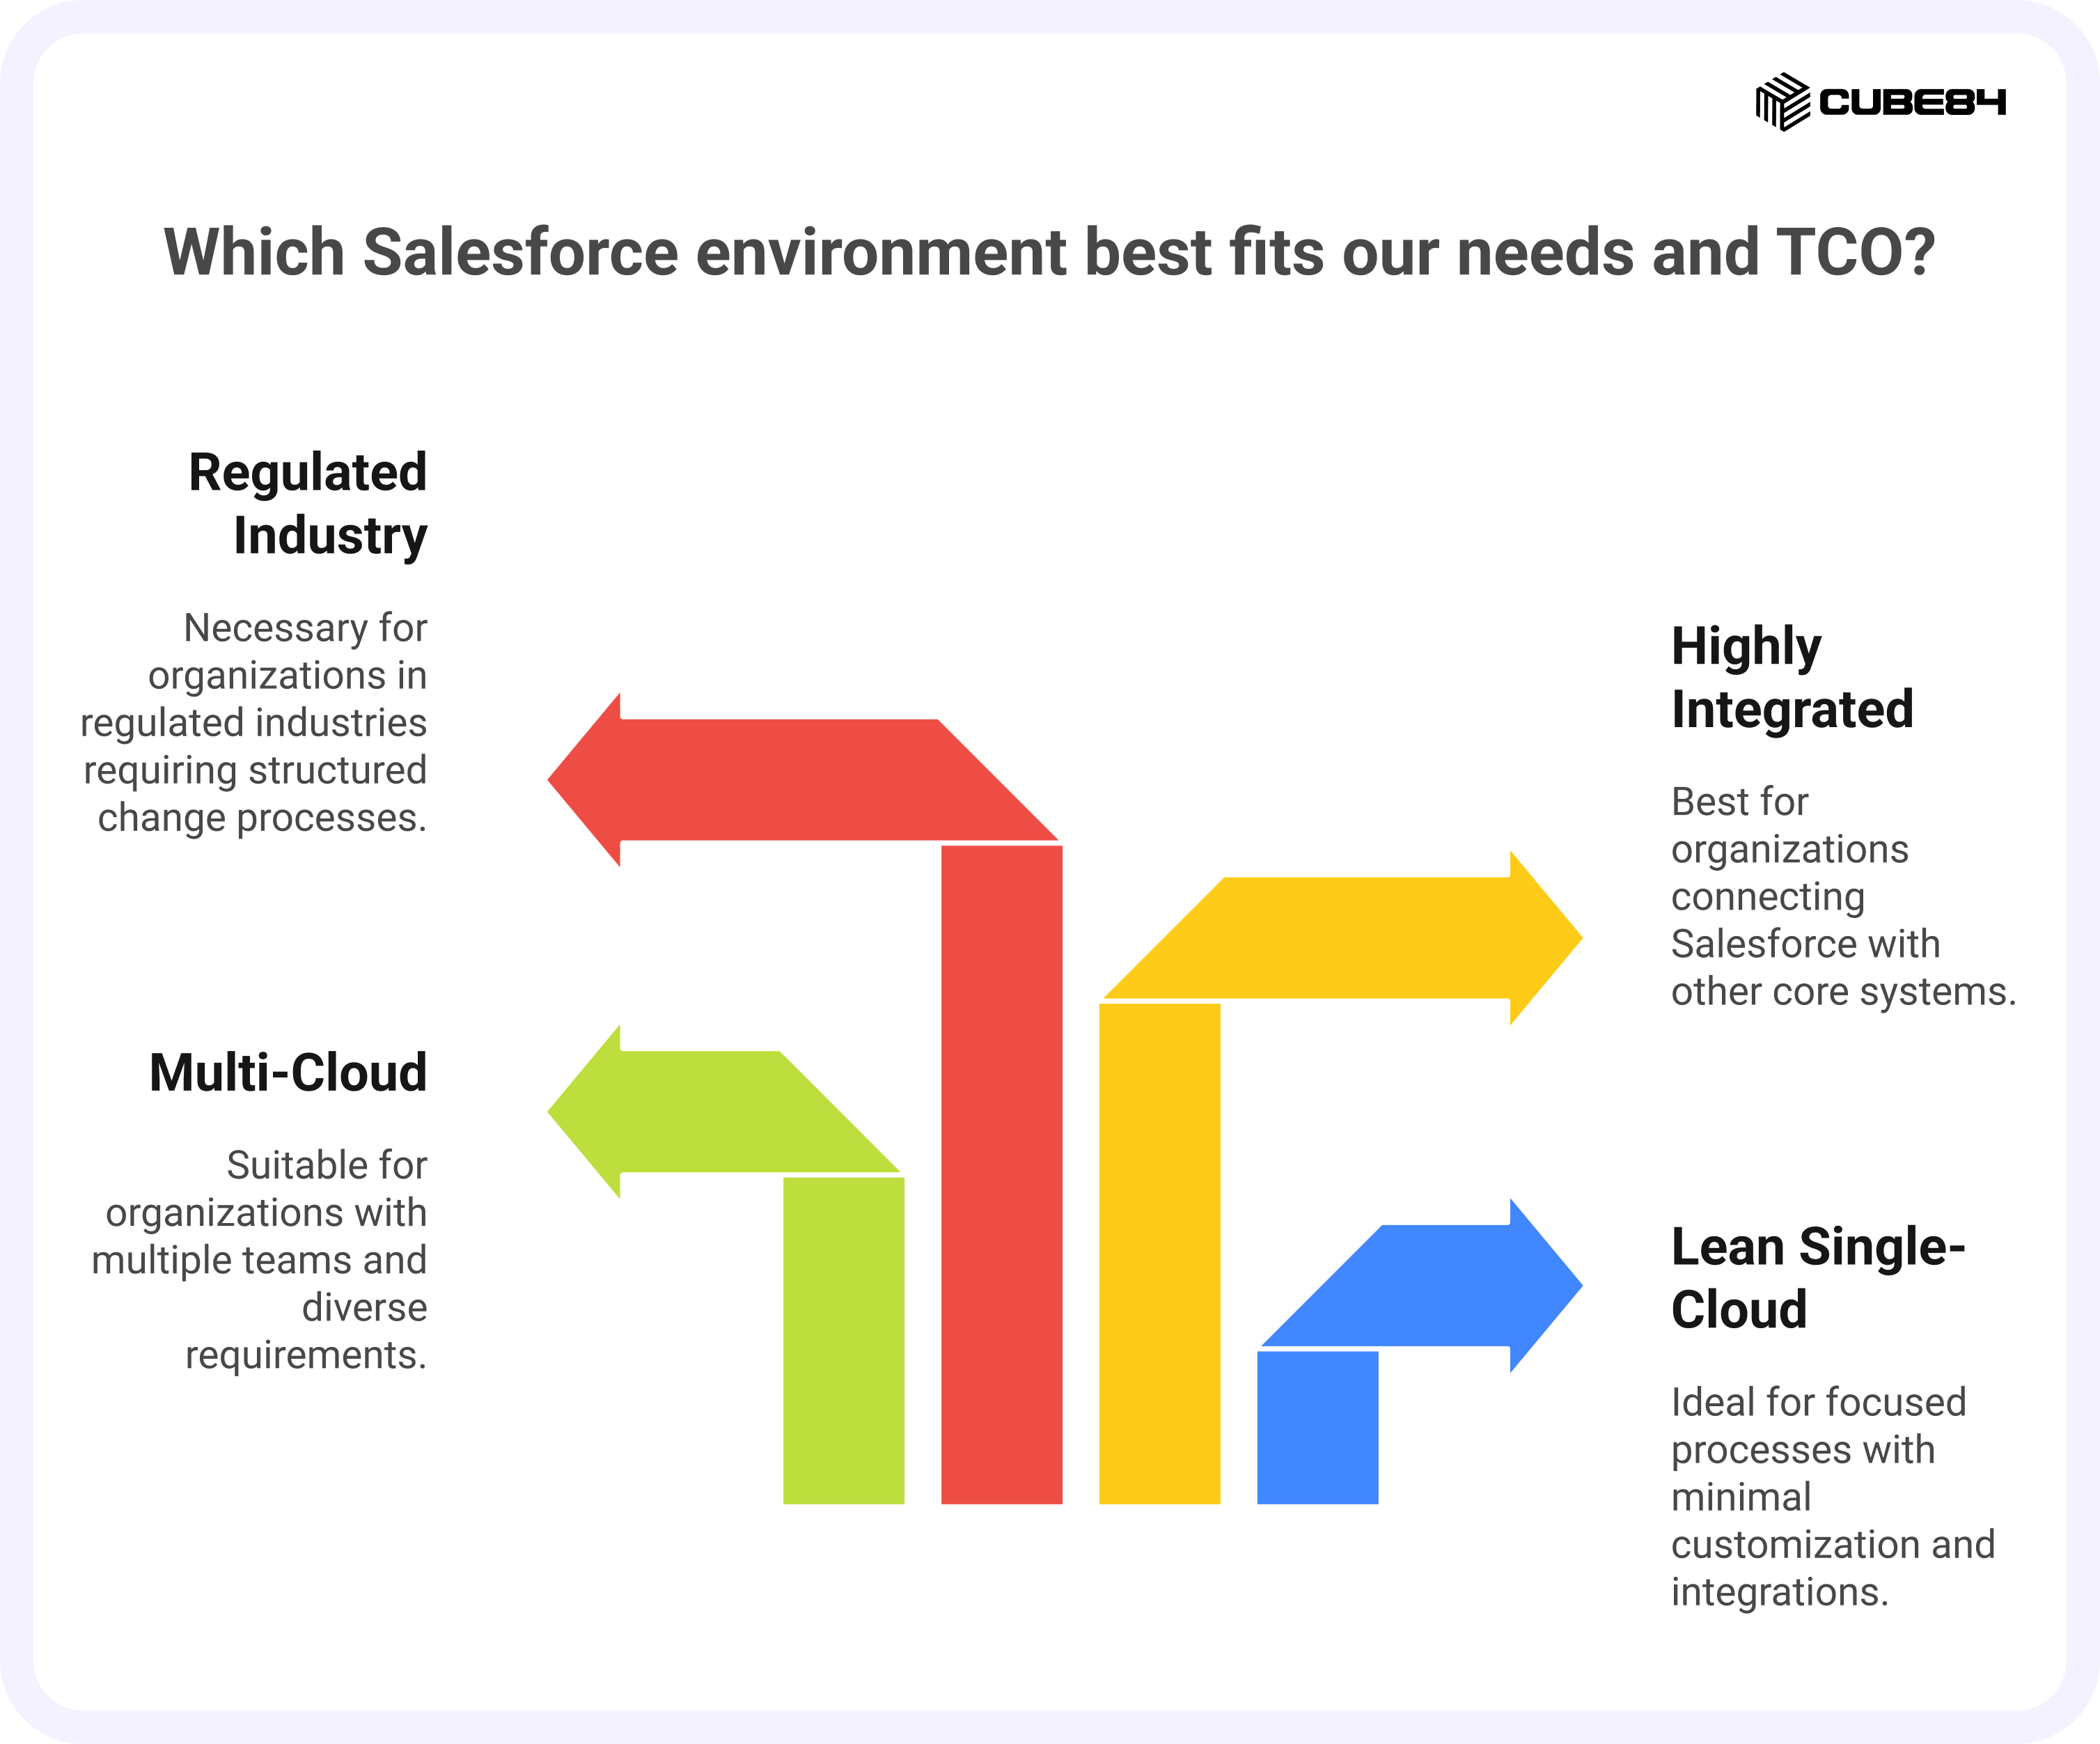
Salesforce TCO shifts based on how the platform is used inside the organization. Licenses may be similar, but the work behind the system changes as the environment becomes more complex. The patterns below help explain why organizations often see very different cost outcomes.
A Lean Single-Cloud Organization
A single-cloud setup supports a focused set of processes with limited customization. Integrations are minimal and administration is handled as part of a broader IT or operations role. Most tasks involve user management, small field updates, and periodic clean-up.
TCO stays steady when changes are simple.
It rises when requests grow without a clear owner. Small fixes done in isolation often introduce inconsistencies, which creates early technical debt even in a light environment.
Typical TCO Distribution (Annual, After Year 1)
Licenses and subscriptions: 35%-55%
Implementation and enhancements: 10%-20%
Personnel: 15%-30%
Integrations and infrastructure: 5%-10%
Data management: 3%-5%
Training and adoption: 3%-5%
Opportunity costs and risk: 2%-5%
This pattern reflects minimal automation and limited integrations. Licenses dominate TCO until complexity grows.
A Multi-Cloud Environment
A multi-cloud setup serves several teams. Sales, service, and portal users depend on Salesforce for their daily work. Each area introduces its own requirements. More features and more teams result in more release cycles and more coordination.
Here, effort becomes a larger part of TCO. Administration, enhancement work, and testing become routine activities. Requests need clear prioritization or they turn into reactive work. Governance helps keep cost predictable as the footprint expands.
Typical TCO Distribution (Annual)
Licenses and subscriptions: 20%-40%
Implementation and enhancements: 15%-25%
Personnel: 25%-40%
Integrations and infrastructure: 10%-20%
Data management: 5%-10%
Training and adoption: 3%-7%
Opportunity costs and risk: 5%-10%
In multi-cloud environments, most cost comes from continuous enhancements, release cycles, and cross-team coordination.
A Highly Integrated Organization
In this pattern, Salesforce connects to other core systems such as ERP, billing, marketing, or a data warehouse. Integrations create ongoing work because changes in one system affect others.
TCO is shaped by monitoring, testing, and coordination. Integration jobs need review. Schema changes require planning. Troubleshooting becomes part of the normal workload.
This environment requires steady technical oversight, which increases maintenance and support effort.
Typical TCO Distribution (Annual)
Licenses and subscriptions: 15%-30%
Implementation and enhancements: 20%-30%
Personnel: 30%-50%
Integrations and infrastructure: 15%-25%
Data management: 10%-15%
Training and adoption: 5%-10%
Opportunity costs and risk: 10%-20%
Here, effort-heavy categories dominate TCO because integrations, architecture oversight, and release rigor all scale with complexity.
A Regulated Industry Environment
Organizations in regulated industries follow structured change processes. Updates move through review, documentation, and approval stages. Compliance requirements influence how features are designed, tested, and released.
TCO increases here not because the platform is larger but because the work has to follow controlled steps. Release cycles include documentation and validation.Security and compliance reviews add time to each change.
This structure helps maintain stability but also increases the ongoing effort needed to support the platform.
Cost distribution in regulated environments varies widely depending on audit controls, documentation workloads, and validation depth. TCO is best evaluated by assessing compliance effort and governance structure rather than fixed percentages.
Note: The ranges mentioned here reflect common patterns across Salesforce environments with similar size and complexity. Actual distribution depends on support structure, data requirements, and the pace of change.
How to Calculate Your Salesforce TCO
Calculating Salesforce Total Cost of Ownership starts with understanding the work required to keep the platform running. TCO is not a single number pulled from invoices. It is the combined cost of licenses, people, integrations, processes, and ongoing operational effort across the organization.
The steps below outline a practical way to calculate TCO using information most teams already have.
Step 1: List All Salesforce-Related Work
Begin by identifying the activities involved in maintaining and improving Salesforce. Use the core TCO categories as a checklist so nothing is missed.
This includes:
1. Administration and user support
2. Enhancements and development work
3. Release testing and maintenance
4. Integration monitoring and troubleshooting
5. Data quality, governance, and compliance activities
6. Training, onboarding, and change management
7. Effort spent fixing recurring issues or technical debt
The goal is to capture what work happens, not where it sits in the org chart.
Step 2: Map Work to Ownership
Next, document who is responsible for each activity today.
This may include:
1. Internal administrators or developers
2. Contractors or staff augmentation resources
3. Managed service providers
4. Shared teams such as IT, security, or data
This step helps clarify how effort is distributed and highlights work that may be unowned or inconsistently handled.
Step 3: Estimate Effort, Not Just Cost
Estimate how much time each activity typically requires over a year.
Use available signals such as:
1. Support ticket volumes
2. Enhancement backlogs
3. Release cycles
4. Integration incident logs
5. Training schedules
6. Data cleanup frequency
Effort estimates do not need to be perfect. Reasonable ranges are enough to build a usable model.
Step 4: Convert Effort Into Cost
Once effort is estimated, translate it into cost using consistent assumptions.
For example:
1. Internal staff: fully loaded cost multiplied by time spent on Salesforce
2. Contractors: average hourly or daily rates multiplied by usage
3. Managed services: annual retainer plus out-of-scope work
4. Tools and platforms: annual license or subscription cost
This creates a consolidated view of what Salesforce costs across teams, not just within IT.
Step 5: Review the Distribution Across Categories
Look at how total cost is distributed across categories such as personnel, integrations, maintenance, and opportunity cost.
This helps you:
1. Identify where most effort is concentrated
2. Understand which costs scale as complexity grows
3. Separate one-time project work from recurring operational cost
Patterns matter more than precision at this stage.
Step 6: Build a Multi-Year View
Finally, extend the model beyond the current year.
Factor in:
1. Planned growth in users or teams
2. New integrations or clouds
3. Governance or compliance changes
4. Known remediation or clean-up work
5. Expected increases in operational workload
A multi-year view makes TCO more useful for planning and avoids short-term budget blind spots.
If you want added confidence in your TCO assumptions, CUBE84 can review your model with you to validate effort estimates, uncover gaps, and confirm whether your cost model reflects how Salesforce actually operates in your organization.

Interpreting Your TCO Results
Your TCO model shows how your Salesforce environment operates and where effort is concentrated. Interpreting these results helps you understand the drivers behind your cost and the areas that may need attention as the platform grows.
What Your TCO View Shows About Your Environment
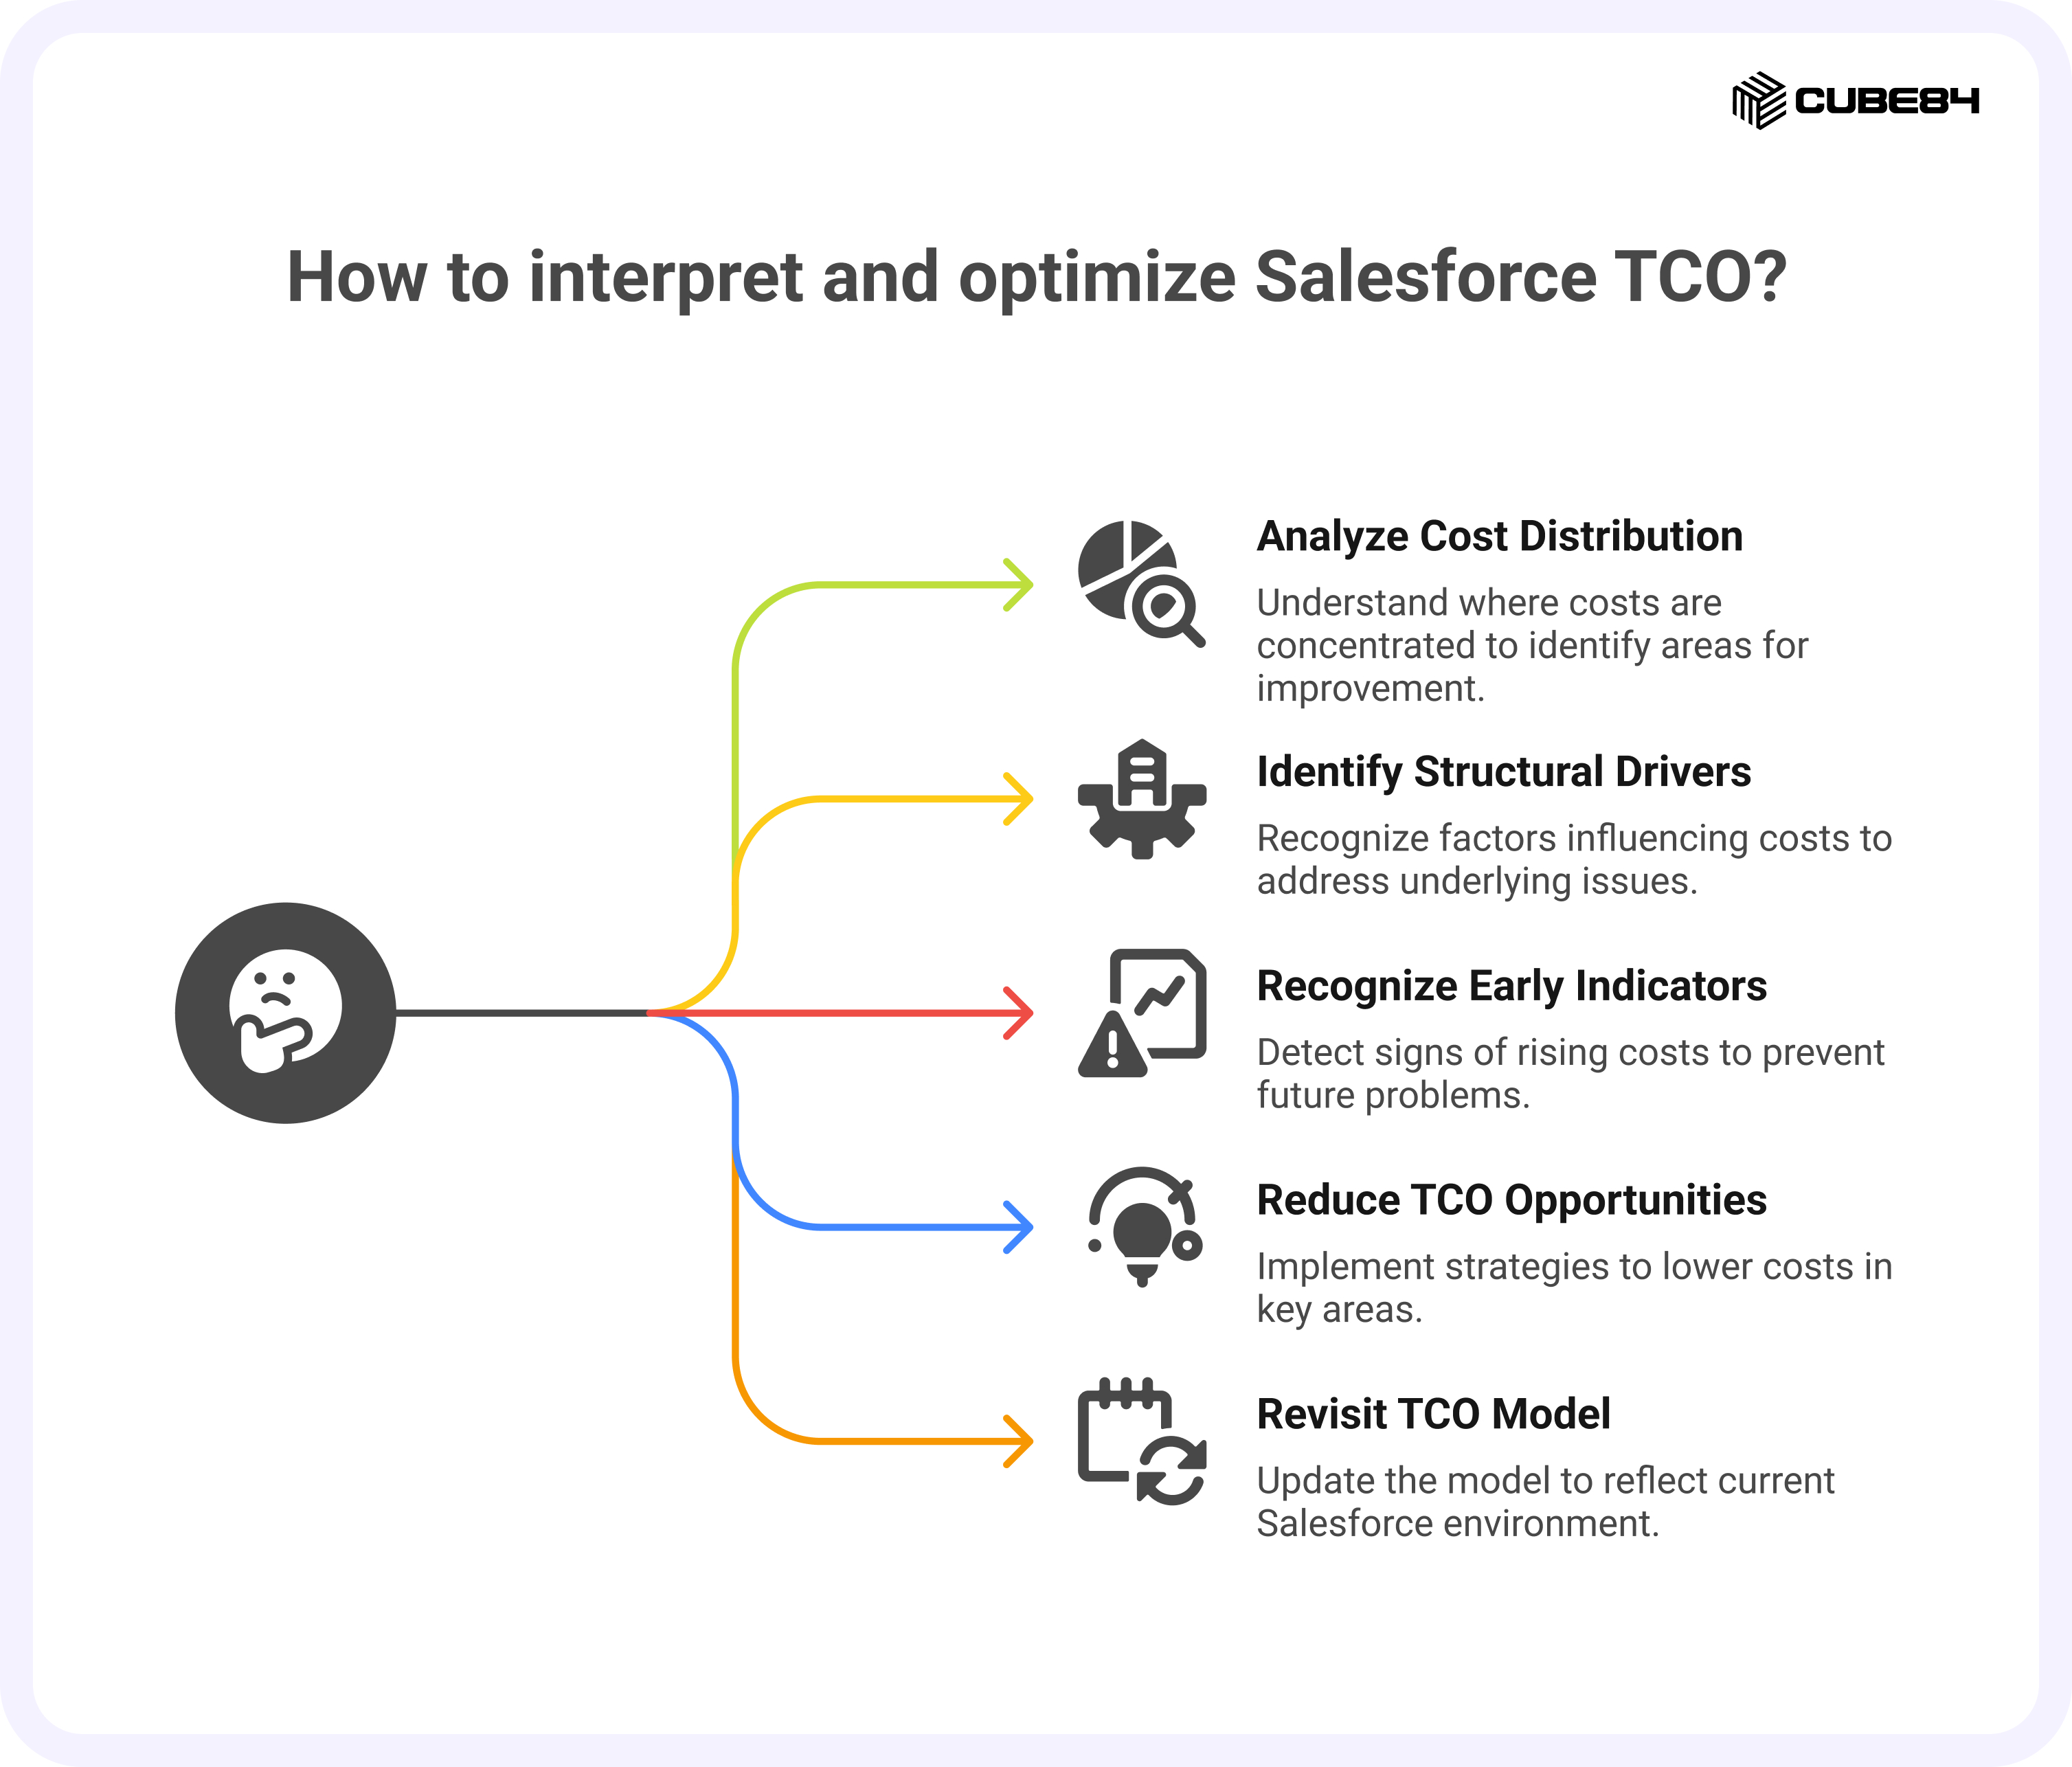
A clear TCO view shows how work is distributed across teams and systems. It highlights where the platform depends on internal staff, where integrations or data processes require steady attention, and where maintenance or enhancements consume time. It can surface gaps in ownership or signs of under-investment in areas like training or data quality. These patterns help explain how your environment functions day to day.
Interpreting Your Cost Distribution
The distribution across categories gives you a grounded view of how your Salesforce program operates. A large share in personnel often shows that your environment relies on continuous hands-on support. Higher effort in integrations usually reflects a connected ecosystem that needs steady monitoring. Rising maintenance effort may indicate recurring issues or an environment that has grown complex. Costs in areas linked to delays or inefficiency often point to technical debt.
The Structural Drivers Behind Your TCO
Most Salesforce costs come from a few structural factors. Data model complexity affects the pace of enhancements. Integrations shape monitoring and troubleshooting effort. Governance structures influence the speed of change. Support models determine how work converts into cost. Customization increases flexibility but adds long-term maintenance. Technical debt increases the time needed to deliver new work. Understanding which of these apply helps explain your cost structure.
Early Indicators of Rising Cost
Your TCO model can reveal early indicators of strain. Rising hours for administrators or developers may signal growing complexity. Frequent regressions after releases can point to fragile customizations. A high volume of support requests may indicate recurring issues. Integrations that break more often may suggest pressure on connected systems. These signals help direct attention before issues become larger concerns.
Where Organizations Usually Find Opportunities to Reduce TCO
A clear TCO model highlights where teams spend most of their time and where work tends to slow or repeat. Most organizations find that their biggest opportunities to reduce effort and improve stability appear in a few common areas.
Where Organizations Can Reduce TCO
1. Integration stability
Integrations that fail often add recurring work. Small adjustments to monitoring, scheduling, or mappings reduce steady maintenance.
According to the Salesforce State of Service report, 44% of service leaders say disconnected systems slow down operational improvements, which increases integration oversight and adds recurring maintenance effort.
2. Technical debt clean-up
Older workflows, unused fields, or outdated logic slow releases and increase troubleshooting. Cleaning these up saves time across several teams.
3. Ownership gaps
When no one owns a feature or process, issues bounce between teams. Clear ownership reduces delays and repeated work.
4. Data quality
Duplicate or inaccurate data creates extra effort in service, sales, reporting, and automation. Small improvements reduce recurring corrections.
5. Governance
Requests that move without structure create rework. A simple intake and review process reduces friction without slowing the teams.
6. Avoidable manual work
Tasks repeated across teams (such as manual updates or frequent fixes) often signal opportunities for small automation that saves ongoing effort.
These areas typically contribute toward the operational expenses which influence TCO more than individual license decisions. Addressing them improves both day-to-day experience and long-term stability.
When to Revisit Your TCO Model
A TCO model stays useful when it reflects how your Salesforce environment is operating today. It should be reviewed at key points where the balance of work, complexity, or responsibilities begins to shift.
Review your TCO model when:
1. Your Salesforce footprint expands
Adding new clouds, new teams, or new integrations changes the amount of work needed to keep the system stable.
2. Your operating model changes
Moving from an internal admin to contractors or a managed service provider affects how effort is distributed and cost is calculated.
3. Technical debt or recurring issues begin to slow delivery
If enhancements take longer or regressions increase, the underlying cost structure may have shifted.
4. Major business or process changes influence system usage
New processes, restructured teams, or updated controls can increase or reduce the effort required to maintain the platform.
If you want added clarity before moving into planning or budget discussions, a thorough review of your TCO model can help confirm assumptions and highlight areas that may need deeper attention.

Using TCO to Plan the Future of Your Salesforce Environment
Your TCO model becomes most useful when it guides the decisions that shape how Salesforce evolves. This four-block framework shows the areas where TCO supports planning across your organization.
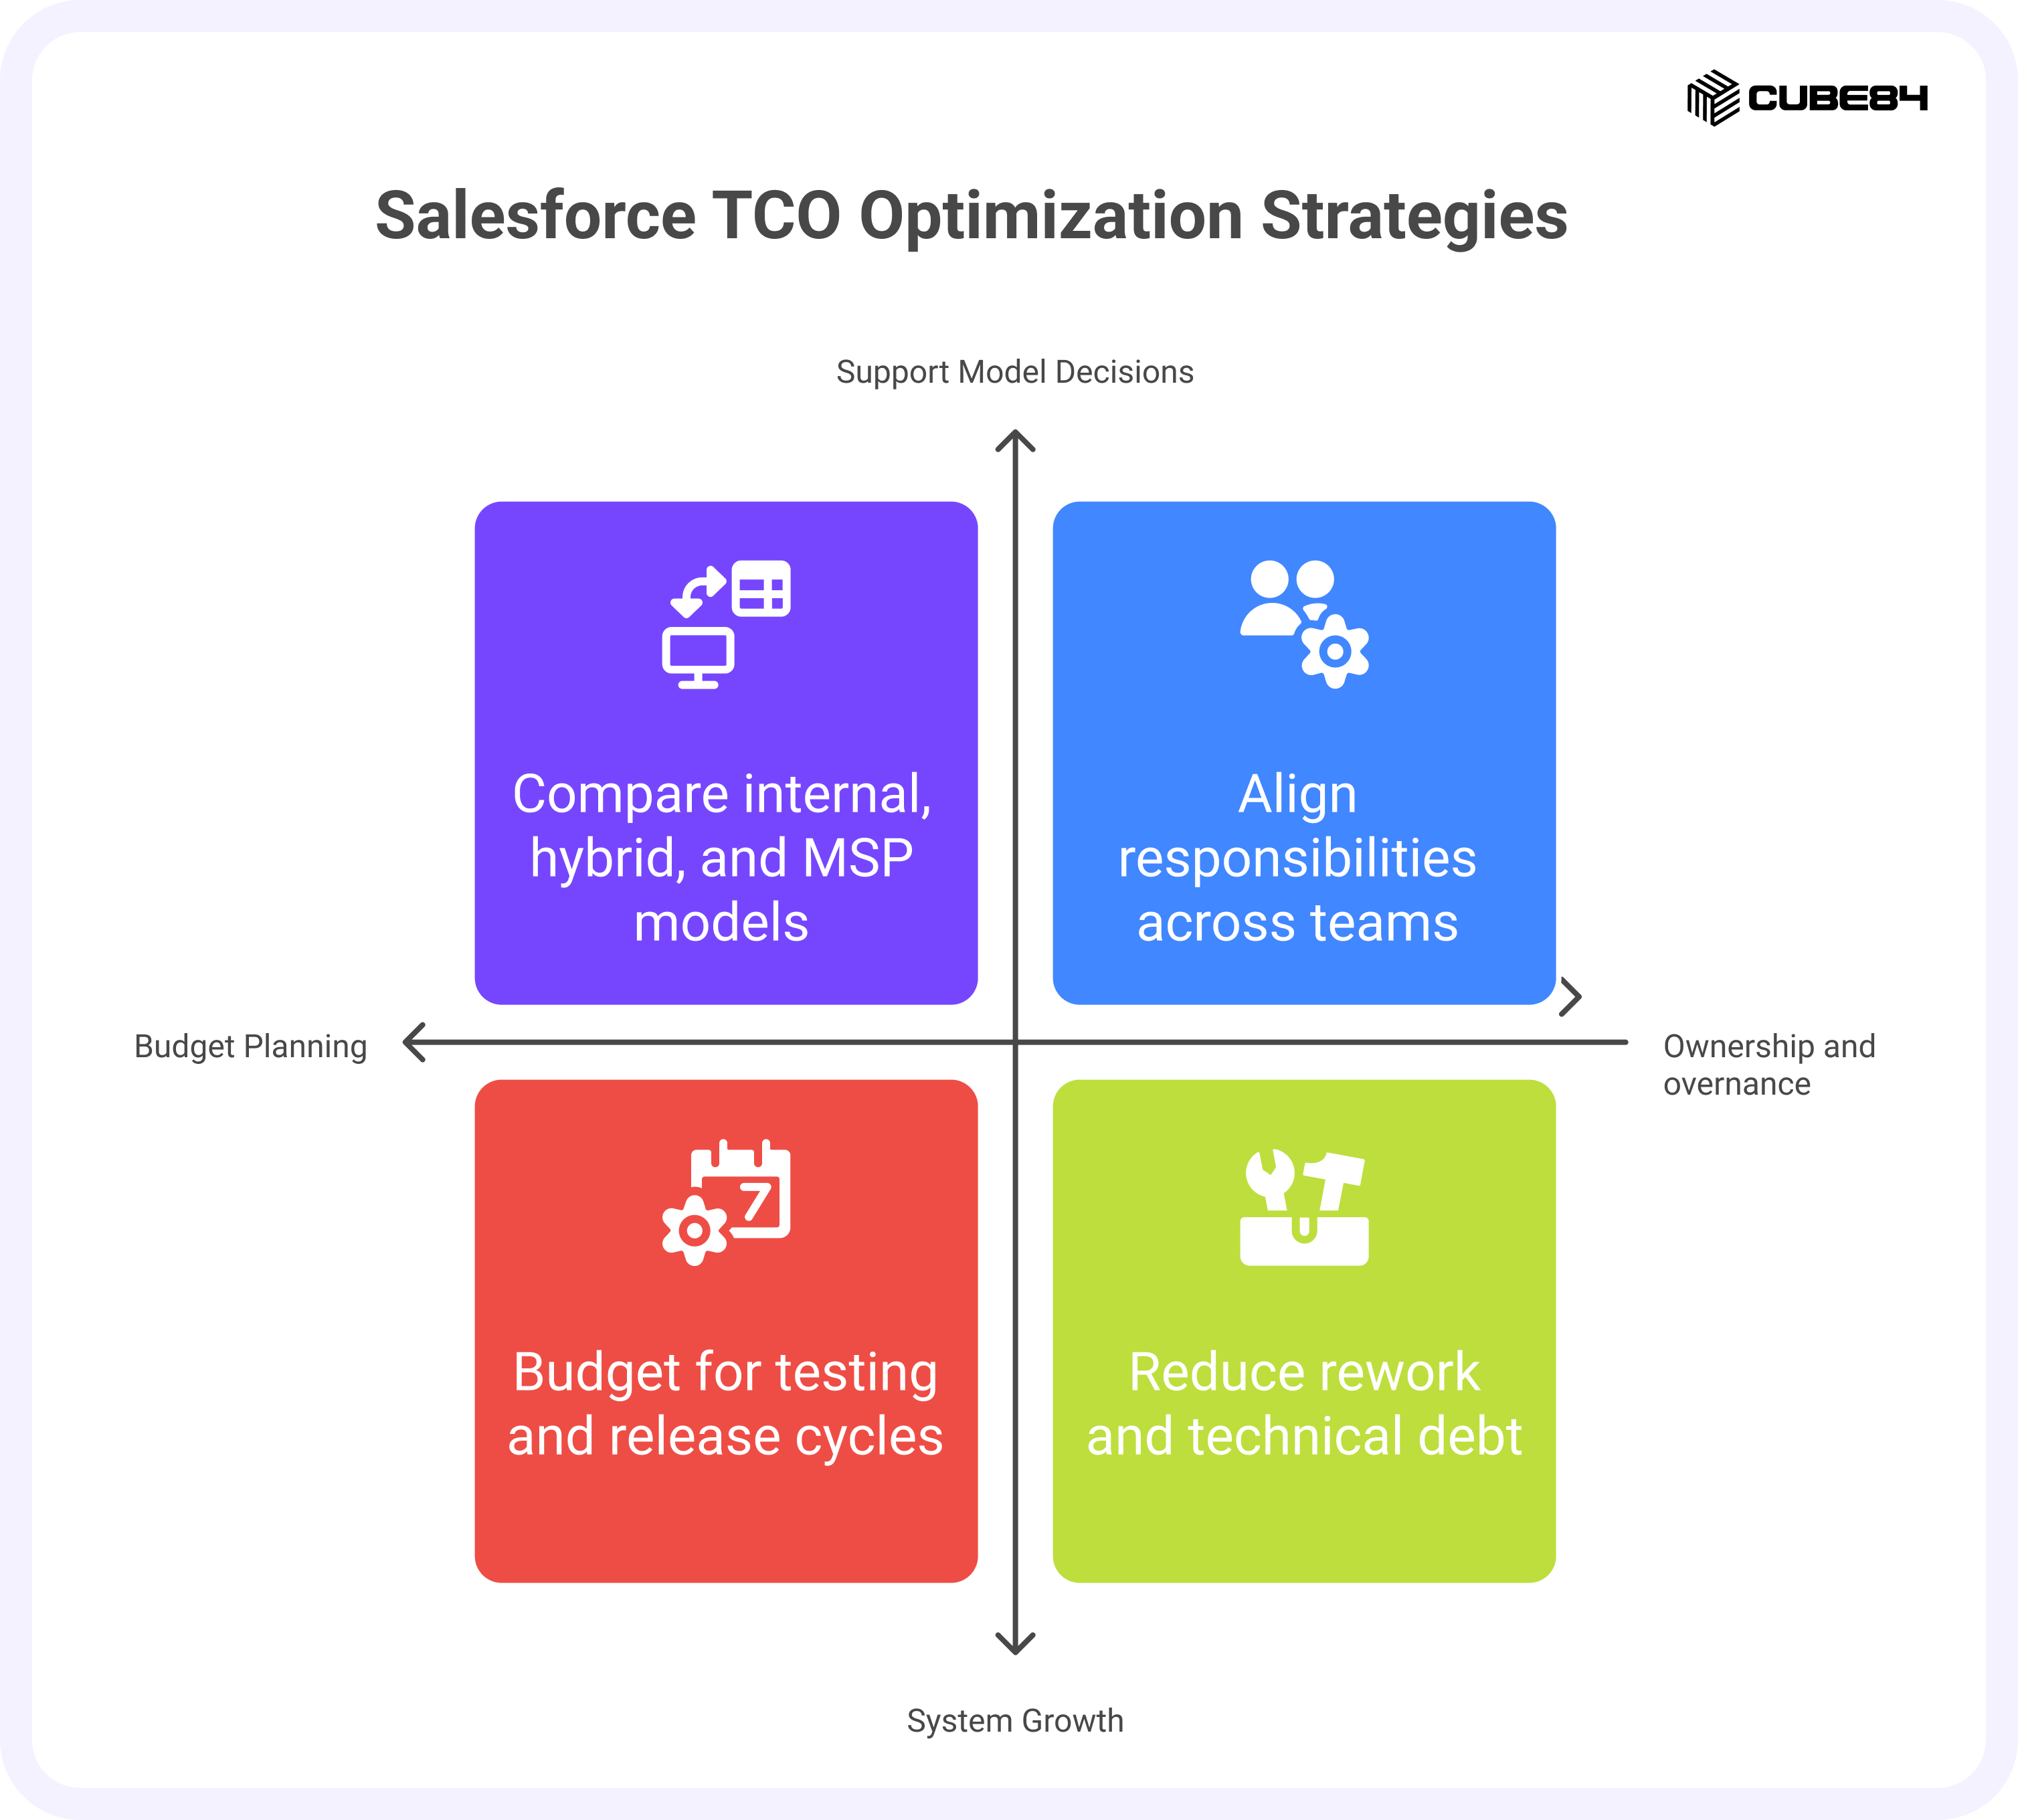
Budget Planning
1. Forecast effort as the environment grows
2. Separate ongoing cost from project cost
3. Identify categories that expand with complexity
4. Support annual budget cycles
Ownership and Governance
1. Clarify who owns each category of work
2. Improve predictability of changes
3. Reduce rework and technical debt
4. Align responsibilities across teams
System Growth
1. Prepare for new teams and clouds
2. Plan for more data and automations
3. Understand integration impact
4. Budget for testing and release cycles
Support Model Decisions
1. Identify signs of stretched capacity
2. Understand rising maintenance effort
3. Compare internal, hybrid, and MSP models
4. Match support to environment complexity
Comparing Support Models Through a TCO Lens
Your TCO model becomes more useful when you compare how different support models shape cost, stability, and workload.The table below outlines the patterns we commonly see across internal teams, contractors, and managed services. It is meant to guide your thinking, not prescribe a “best” choice. Each model works well when matched with the right environment.
Support Model Comparison
Support Model | Strengths | Considerations | When It Works Best |
Internal Team | Deep context of business processes. Quick access to stakeholders. Consistent ownership. | Higher fixed cost. Recruiting and retention challenges. Limited coverage for specialised or occasional needs. | Stable environments with steady demand and clear ownership. |
Contractors / Staff Augmentation | Flexible capacity. Access to specific skills for short periods. | Higher hourly cost. Knowledge often leaves with the resource. More oversight needed. | Projects, targeted skill gaps, or short phases of high demand. |
Managed Services | Predictable cost. Consistent coverage. Access to multiple skill sets. Supports both maintenance and enhancements. | Predictable cost. Consistent coverage. Access to multiple skill sets. Supports both maintenance and enhancements. | Growing or complex environments with recurring work and a need for reliable support. |
This comparison helps you evaluate which model fits your workload more naturally and how each one shapes your TCO over time.
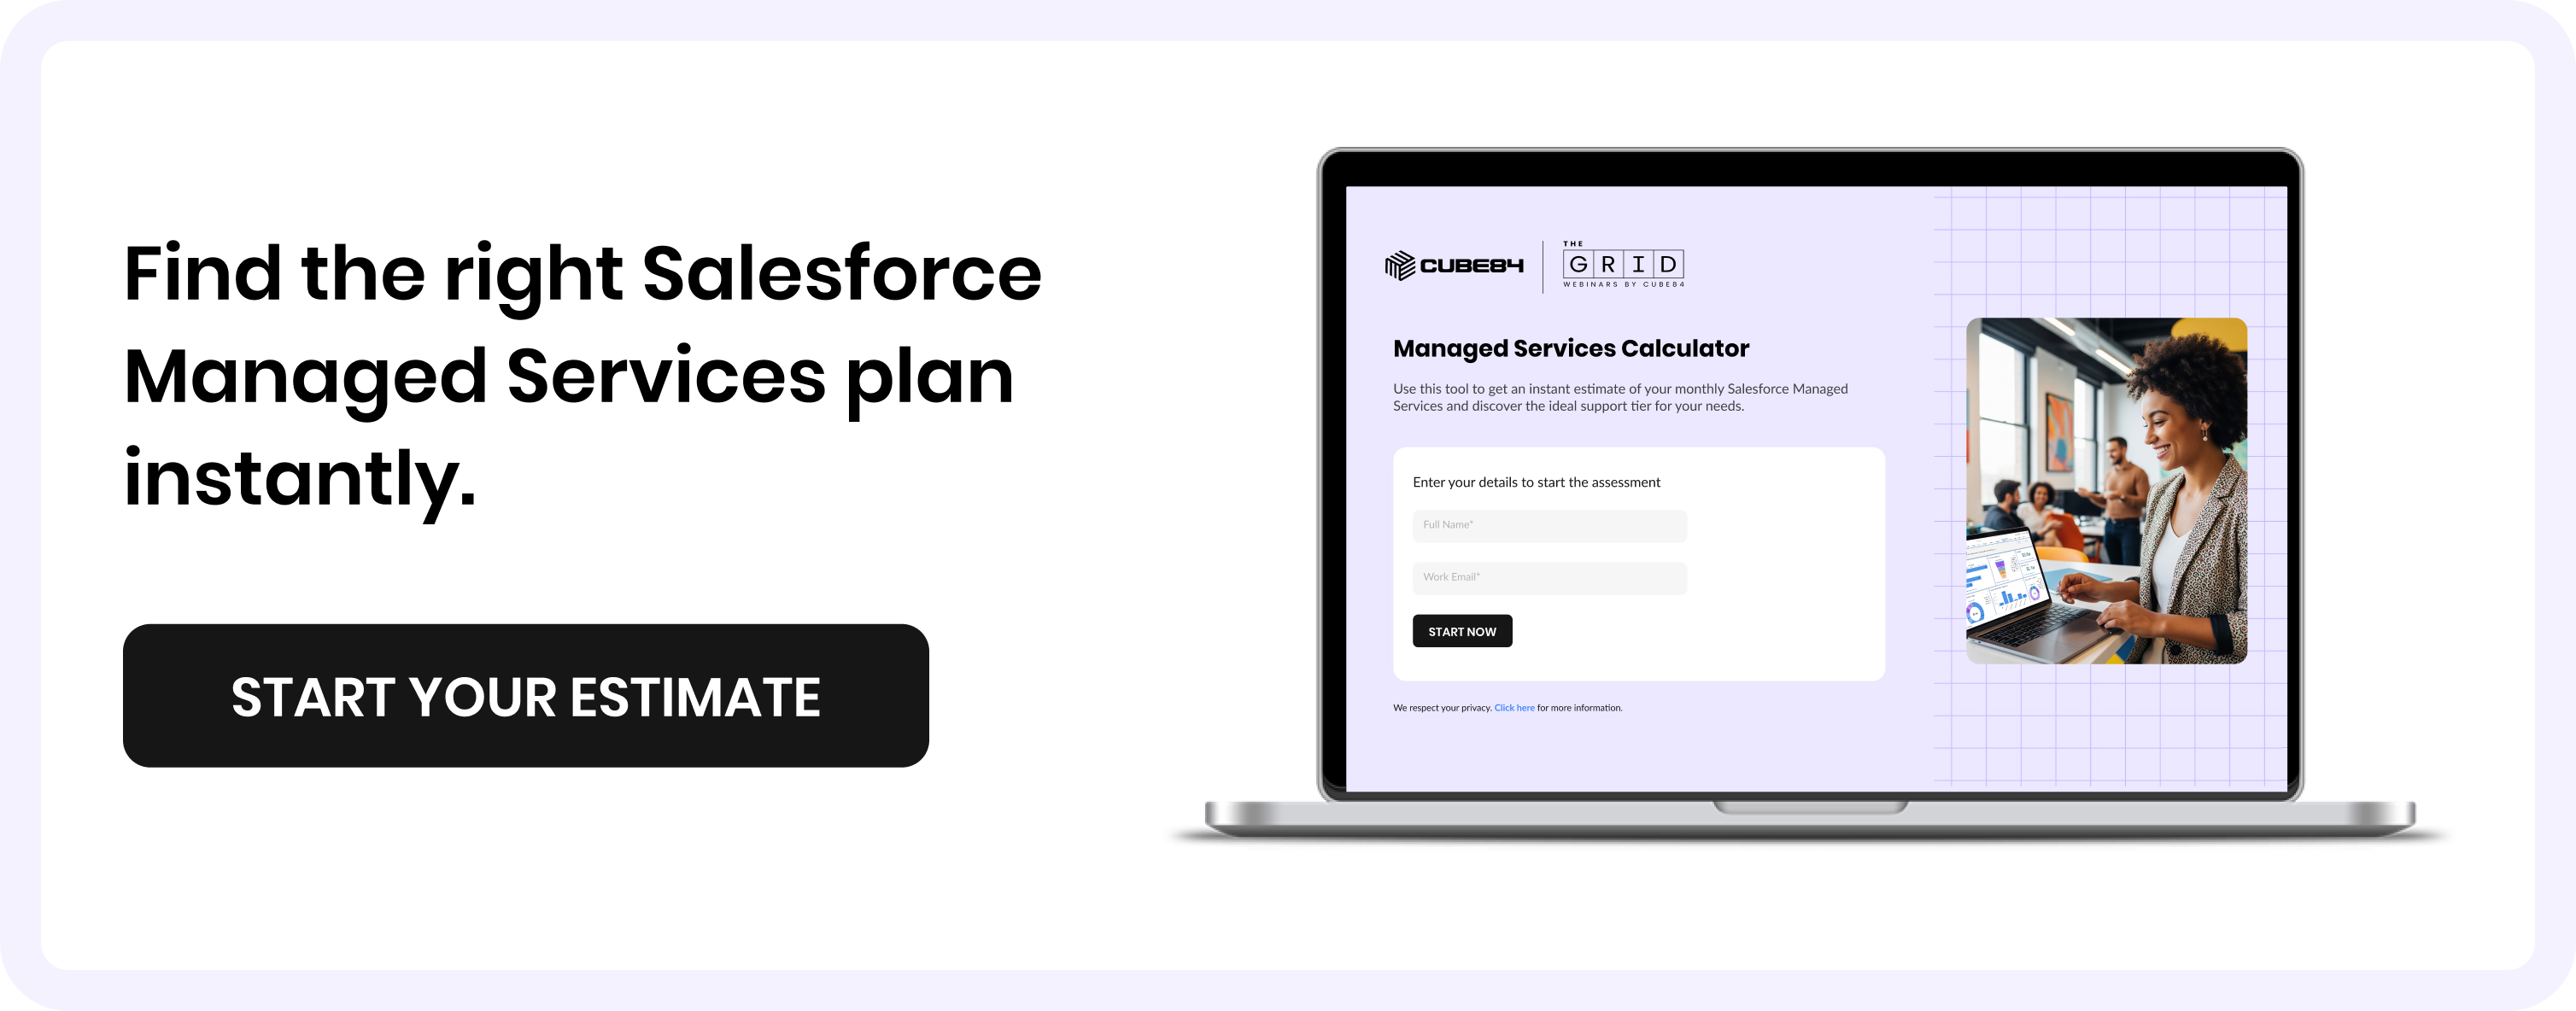
Explore Support Scenarios With CUBE84’s MSP Calculator
Once you understand how different support models shape effort and cost, the next step is to explore how those patterns apply to your own environment.
The CUBE84 MSP Calculator helps teams compare internal, hybrid, and managed services approaches using the TCO drivers outlined in this guide. It is designed to support planning conversations by showing how changes in ownership, workload, and complexity can shift effort and cost over time.
The calculator does not replace a full TCO assessment. It provides a structured way to model scenarios, validate assumptions, and prepare for budget or operating model discussions.
Next Steps and Resources
This guide gives you the structure needed to understand your Salesforce TCO and build a model that supports planning, budgeting, and system decisions. These articles offer additional guidance on decisions that affect Salesforce cost, ownership, and performance. They complement the TCO framework by addressing areas that often influence long-term spend.
1. Managed Services vs. In-House Admin: What’s the Best Fit for Growing Teams?
A clear look at how different support models shape workload, cost, and long-term flexibility.
2. Are You Using the Right Salesforce Licenses? A Quick Audit Guide
Practical steps to review your current licenses and ensure they match your team’s actual usage.
3. Salesforce Implementation Cost: What You Need to Know
An overview of the elements that shape implementation cost and how organizations should plan for them.
4. The Hidden Cost of Not Auditing Your Salesforce Org Annually
Why regular audits reduce rework, improve stability, and prevent rising cost over time.
5. Staff Augmentation vs. Outsourcing: What’s the Difference?
A comparison of two delivery models and how they influence cost, control, and scalability.